Duration 8:29
How To Create Custom Legend For Doughnut Chart In Chart JS 4 Part 7
Published 24 Aug 2023
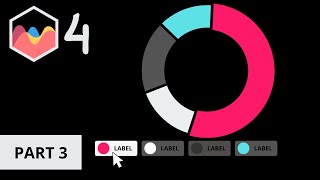
How To Create Custom Legend For Doughnut Chart In Chart JS 4 Part 7 In this video we will explore how to create custom legend for doughnut chart in chart js 4. This is part 7. Creating a custom legend with the information of Chart.js is not straighforward. We will make a HTML legend and make it clickable and add a hover or mouseover effect. Part 1: /watch/45PbpPGppPBpb Part 2: /watch/AGpuBwNLB0cLu Part 3: /watch/M2WMCvn_rb4_M Part 4: /watch/kWrGSX75AQ45G Part 5: /watch/0pcNOM3hlCehN Part 6: /watch/wsZv81kSQJ6Sv Part 7: /watch/Q6-17uVFeCXF1 Part 8: /watch/8WooMSBG2nFGo Source Code: https://www.patreon.com/chartjs Discord: https://discord.com/invite/EWeq92fXeT Let's explore this. Starting Code: https://www.chartjs3.com/docs/chart/getting-started/ Udemy Course: https://www.udemy.com/course/chart-js/?referralCode=56B57F673E9D41FF4AD2 ▬ Materials/References ▬▬▬▬▬▬▬▬▬▬ Starting Code: https://www.chartjs3.com/docs/chart/getting-started/ To keep the video short we might expect you to know parts. These parts we have explained in other videos. You can find the references here below: Understand setup, config and render init blocks: /watch/goNH5tbiuFpiH Understanding Object Destructuring in Chart JS: /watch/IuySaJcfxZ_fS Understanding ChartArea in Chart JS: /watch/YEhVR3YHCgNHV ▬ Got a Question? Comment! ▬▬▬▬▬▬▬▬▬▬ Got a question or special request about a specific item? Comment below and tell me your question. I will make sure to follow up on you! ▬ Find Me Here ▬▬▬▬▬▬▬▬▬▬ Blog: https://www.chartjs3.com/chart-js-blog/ Website: https://www.chartjs3.com Udemy Course: https://www.udemy.com/course/chart-js/?referralCode=56B57F673E9D41FF4AD2 Chart JS tutorials for Beginners: 🎓 Beginners Serie: /watch/kIV5uw7ia6Wi5 Chart JS tutorials for Intermediate: 👁️ Most Watched Chart JS Video: /watch/0H8TTxxcfj4cT ⭐ Personal Favorite Chart JS Video: /watch/4lzHy1WYFuPYH Chart JS Dashboard Series: 👍 Most Liked Video Series: Watch Part 1: /watch/UBXHipVnM3lnH Watch Part 2: /watch/oSRrbL-oUDfor Watch Part 3: /watch/4zr8aDd5tlx58 ▬ About Us ▬▬▬▬▬▬▬▬▬▬▬▬ Why we created these #chartjs and #javascript video tutorials? WHY Creating charts in javascript is very rewarding but extremely challenging. The Chart JS library made it easier to render charts. However the chart js documentation is hard to understand for many. It requires a lot of different moving parts to work along. The canvas tag, javascript, arrays and Chart JS all need to be combined to draw an eye catching bar chart or line chart. The videos explains the chart js documentation in a more visual and easy to understand way. You can follow along with the code and quickly grasp how it works. We cover the code in chart js but also what truly happens and why something happens when we write a line of code. This fundamental understanding gives clarity to you as a developer in chartjs. In short it is the Chart JS video documentation. HOW We answer questions from YOU (viewers) by creating an answer video that covers the questions YOU have posted in the comment section. WHAT Our goal is to help YOU learn how to draw charts in Chart JS by showing you in video format how to do it. Chart JS 3 Video Documentation Site: https://www.chartjs3.com Chart JS 4 Video Documentation Site: https://www.chartjs4.com ▬ Chart JS 4.3.3 ▬▬▬▬▬▬▬▬▬▬▬▬ Chart JS is a javascript library to draw charts in the canvas tag on your site. Presenting data in a visual manner such as charts is more effective and appealing. All the charts are always coded in the latest Chartjs version which is as of this recording Chart JS 4.3.3. What type of charts can you make with Chart.JS? With chart js you can make line chart, bar chart, pie chart, doughnut chart, scatter chart, polar area chart, radar chart, gauge chart and area chart. And with some clever tricks and visual adjustment more can be done.
Category
Show more


Comments - 0
Related videos for How To Create Custom Legend For Doughnut Chart In Chart JS 4 Part 7: